Help with linear gauge showing the value with a gradient
Posted: Tue Jan 04, 2011 7:52 pm
Hello,
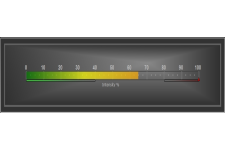
I am trying to code a gauge that looks like the following (from the steema website). I seem to be unable to specify that I want the value bar to have a gradient, as in this picture it goes from green to red? Could someone give me some code to set a gauge with a gradient as in the picture. I have TeeChart Pro version 2010 for Delphi 2009.
Thanks,
Hardee Mahoney
Washington, DC