Page 1 of 1
Drawing Lines in 3D Chart
Posted: Thu May 31, 2007 12:06 pm
by 9245066
Hi again^^
Hopefully you can help me once more.
Now I have to draw lines in my 3D Chart.
Everything about Lines I found yet, is about drawing
them in 2D (Nothing like AddXYZ(x1,y1,z1,x2,y2,z3))
Background:
I have a set of values. All of them are related to some
special area where they where measured. No I
visualize these values with a SurfaceSeries. What I have to
do now is to visualize the borders between the special areas,
best would be on the SurfaceSerie itself.
Any suggestions?
thanks in advance,
HMI
Posted: Thu May 31, 2007 1:17 pm
by narcis
Hi HMI,
The best option here may be using TPoint3DSeries which already has AddXYZ method. If you don't want to see the pointers you can do this:
Posted: Mon Jun 04, 2007 8:32 am
by 9245066
You mean, adding the Points in the right way and display there connection lines?
Mhh, sounds possible, but maybe a bit difficult. I will look
how this works.
I will report back.
Posted: Mon Jun 04, 2007 8:36 am
by narcis
Hi HMI,
Yes, that's what I mean, plotting 3D points with X,Y and Z coordinates but making the points not visible, just its connecting line.
Posted: Mon Jun 04, 2007 1:54 pm
by 9245066
Ok, back again from testing.
Although this idea is not bad, it fits not my requirements.
I try to explain it:
In this picture you can see an example graph
of my problem:

the problem is, that at the rising curve I only have the values from the
bottom and the top.
But the area change is between these two values.
If I interpolate the possible y values for the line, then it can
happen that the line is over or under the surface, depending on
the interpolation algorithm.
But by viewing this sample picture, I got another idea:
There are already lines at the surface(ContourPlot), one of these could fit my desired line. Is it possible to show only a specific contour line?
unfortunately I don't think so...
Kind regards,
HMI
Posted: Mon Jun 04, 2007 2:41 pm
by narcis
Hi HMI,
Sorry but I don't understand what is your exact problem and what you are trying to achieve. Could you please give me more detailed information?
Thanks in advance.
Posted: Mon Jun 04, 2007 2:54 pm
by 9245066
Hi Narcis,
I thought it would not be easy to understand me^^
I try it again.
The image on which I try to explain:

I have a set of Gridpoints(regular positions, not that diffuse like in the picture), x and z for the position, y the value.
Theses Gridpoints belong to a "cell" (4 cell's in the sample).
What I want to do is visualize the cell borders.
But I only have the y values of the gridpoints.
If I want to draw a line representating the borders, I need
there "y values" to draw them "on" the surface.
To get those y values I can only interpolate between the gridpoints
around the cellborder. But by doing this it can happen that the y values
are not at the same level as the surfaceSerie in this point.
that would mean the line is under or above the Surfaceserie.
But I want it on top, like the ContourSeries lines.
Saying this, I thought it could be possible, if the contourSeries
shows only 1 specific y level line.
Is this possible?
Hope now it gets a bit clearer...
Kind regards,
Hmi
Posted: Tue Jun 05, 2007 11:20 am
by narcis
Hi HMI,
Thanks for the information.
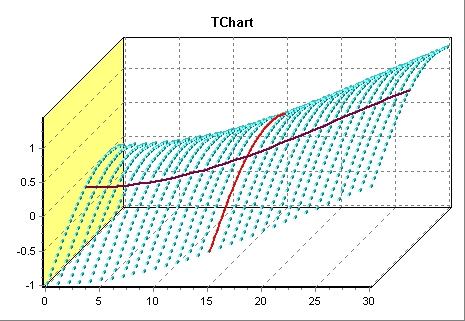
We think we understood what you are looking for. We suggest you to use 3 Points3D series like this:
Code: Select all
procedure TForm1.FormCreate(Sender: TObject);
var
x, z, numValues : Integer;
begin
  numValues:=30;

  for x:=0 to numValues do
    for z:=0 to numValues do
      Begin
        Series1.AddXYZ(x,Sin(z/numValues*2)-Cos(x/numValues*2),z);
        if (x=15) then
          Series2.AddXYZ(x,Series1.YValues.Last,z);
        if (z=15) then
          Series3.AddXYZ(x,Series1.YValues.Last,z);
      end;
end;
Instead of having Series2 and Series3 following Series1 data you could also set them to IrregularGrid=true and use double x and z values to plot an interpolated grid that fits your needs.
Also notice that Series1 is a Points3D series with no lines visible while Series2 and Series3 are Points3D series as well but only displaying its lines and no pointers.
Posted: Wed Jun 06, 2007 7:18 am
by 9245066
That seems a good solution. I will see in how far I could
implement it in my code.
Thanks again, and have a nice day,
HMI