Smooth 3-D pie charts, ala Rube Goldberg
Posted: Tue Nov 18, 2008 8:49 pm
Folks,
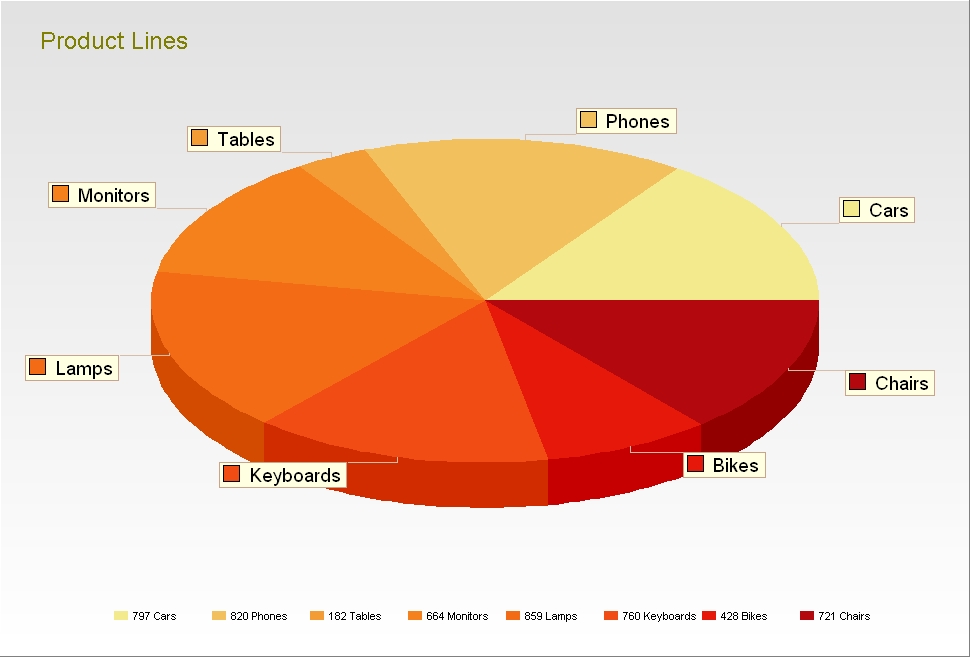
The goal is a smoothly-rounded 3D pie chart. One with sharp clear text.
I then take that chart, and save it to file using either SaveToBitmapFile or SaveToMetafileEnh. Lastly, that graphic file gets inserted into my document (I use the fabulous WPTools).
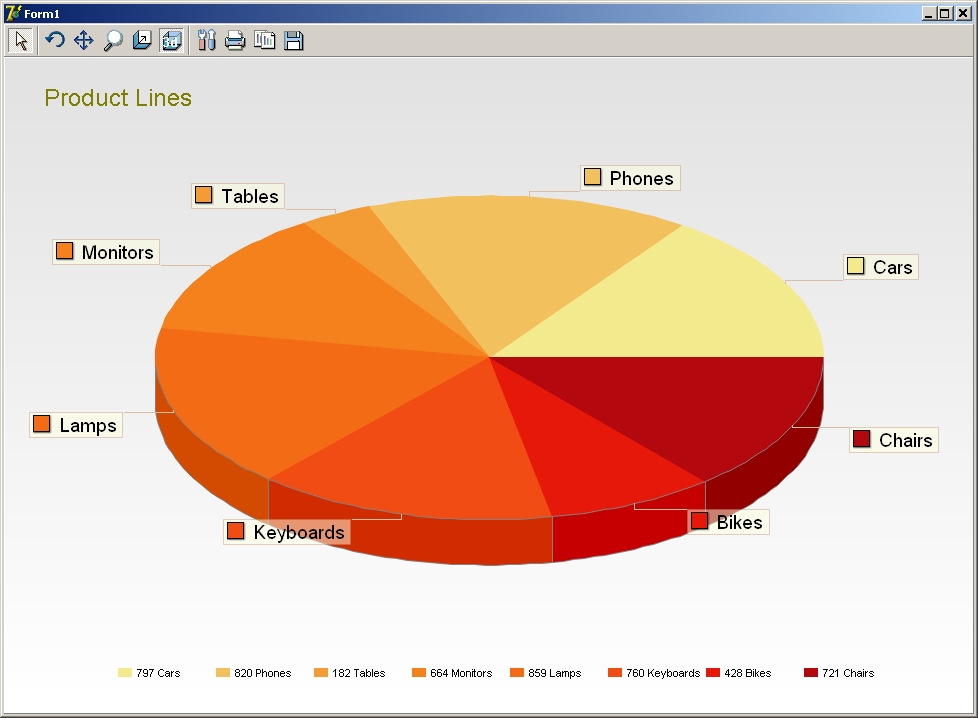
Most approaches I've seen out there, including your own (be it SmoothStetch, StretchDraw, various Antialias schemes) *do* help smoothen out the jaggies of the pie chart's outer edge, and slice lines. Some do a better job than others.
But the price paid for that is blurry, non-sharp text. The slice labels, legend item text, chart headers, etc, all of them, fuzzy. The more effective the jaggie smoothing, the more affected the text, losing its sharpness.
And that's the problem, blurring of text, that I'm trying to address: combine a smoothed-out 3D pie chart with crisp, clear, text, in effect, a two-step pie chart production:
1) the chart without text, which is then antialiased or smoothed out, then
2) add text on top of that
So how can I produce a 3D pie chart with no text (no labels, no title, footer, legends, etc), by for instance setting their Visible properties False, and, here's the main question, have that pie chart be the SAME SIZE size as though the labels, legends, title, etc WERE there, and Visible?
If I could do that, I'd then try something like:
1) SaveToMetaFileEnh,
2) do some processing of the bitmap, smoothing out the jaggies of the bitmap, rounding the chart. That I can already do
3) bring the bitmap back to the canvas (via Chart1.Canvas.Draw ( 0, 0, savedImagesBitmap)),
4) draw the various text elements on top of that just drawn-on canvas.
As a somewhat related question, how can I retrieve the X and Y radius of a pie chart, or some other Chart property involving just the PIE chart's actual height and width (not Chart1.Width and Chart1.Height) after it's been drawn? I was hoping CustomXRadius and CustomYRadius would be set to a non-zero value after the chart's drawn, but that's not the case.
Okay, so I ramble. Shoot me... Lots of coffee today!
Thanks in advance..
Regards,
richard diamond
(TeeChart V 7.12)
The goal is a smoothly-rounded 3D pie chart. One with sharp clear text.
I then take that chart, and save it to file using either SaveToBitmapFile or SaveToMetafileEnh. Lastly, that graphic file gets inserted into my document (I use the fabulous WPTools).
Most approaches I've seen out there, including your own (be it SmoothStetch, StretchDraw, various Antialias schemes) *do* help smoothen out the jaggies of the pie chart's outer edge, and slice lines. Some do a better job than others.
But the price paid for that is blurry, non-sharp text. The slice labels, legend item text, chart headers, etc, all of them, fuzzy. The more effective the jaggie smoothing, the more affected the text, losing its sharpness.
And that's the problem, blurring of text, that I'm trying to address: combine a smoothed-out 3D pie chart with crisp, clear, text, in effect, a two-step pie chart production:
1) the chart without text, which is then antialiased or smoothed out, then
2) add text on top of that
So how can I produce a 3D pie chart with no text (no labels, no title, footer, legends, etc), by for instance setting their Visible properties False, and, here's the main question, have that pie chart be the SAME SIZE size as though the labels, legends, title, etc WERE there, and Visible?
If I could do that, I'd then try something like:
1) SaveToMetaFileEnh,
2) do some processing of the bitmap, smoothing out the jaggies of the bitmap, rounding the chart. That I can already do
3) bring the bitmap back to the canvas (via Chart1.Canvas.Draw ( 0, 0, savedImagesBitmap)),
4) draw the various text elements on top of that just drawn-on canvas.
As a somewhat related question, how can I retrieve the X and Y radius of a pie chart, or some other Chart property involving just the PIE chart's actual height and width (not Chart1.Width and Chart1.Height) after it's been drawn? I was hoping CustomXRadius and CustomYRadius would be set to a non-zero value after the chart's drawn, but that's not the case.
Okay, so I ramble. Shoot me...
Thanks in advance..
Regards,
richard diamond
(TeeChart V 7.12)

