I have created a simple stacked area chart.
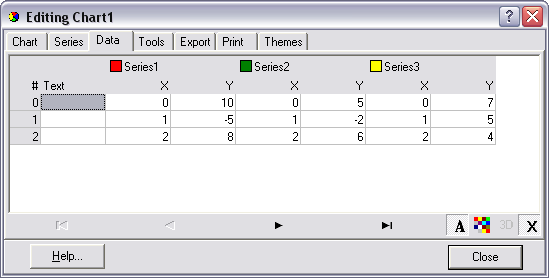
It contain 3 series with 3 points at each, and filled it with data like on the picture:

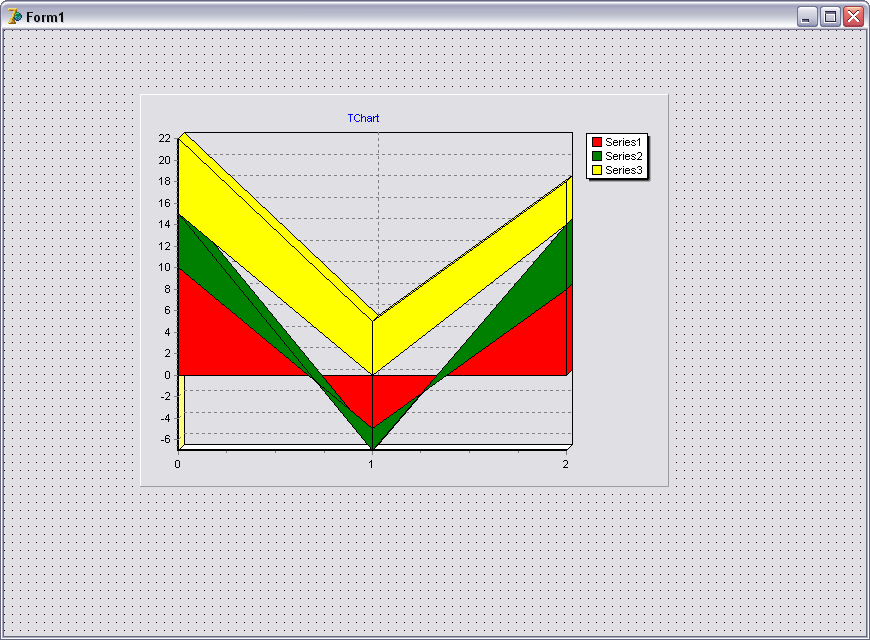
and I got this result:

but same chart in "MS excel" looks different, it fills last series to the last negative point(from previous chart) , but teeChart fills last series to the zero point.
In "MS Excel" this chart looks like on this picture:
So my question is :
Does it possible to create stacked aria chart like in "MS Excel" ?
I'm using TeeChart 7.07 pro.
Thanks.


