When I fill colorgrid with Double.Nan and/or Color.Transparent parameter it not shown correctly the other colorpoints.
Here's example:
tChart1.Axes.Left.Automatic = false;
tChart1.Axes.Left.Maximum = 3;
tChart1.Axes.Left.Minimum = 0;
tChart1.Axes.Left.Inverted = true;
tChart1.Axes.Bottom.Automatic = false;
tChart1.Axes.Bottom.Maximum = 5;
tChart1.Axes.Bottom.Minimum = 0;
tChart1.Walls.View3D = false;
tChart1.Walls.Back.Color = Color.White;
tChart1.Aspect.View3D = false;
for (int i = 0; i < 3; i++)
{
for (int j = 0; j < 5; j++)
{
//colorGrid1.Add(j, i*j, i ,Color.White);
if (j == 0 || j > 3)
colorGrid1.Add(j, Double.NaN , i);
else
colorGrid1.Add(j, i*j, i);
}
}
Double.NaN caused that every point in colorgrid has same color (color grid looks solid)
if I add a Color.Transparent - parameter
=> colorGrid1.Add(j, Double.NaN , i, Color.Transparent);
this caused that left and right edges are transparent but center value points are solid?
If I used earlier version of TeeChart, let say ver 1.1.1879, it hides the left and right points correctly and also coloring correctly each color point in center, so what changes is happend after that!
And are there workaround / fixes for this? Because what I check the earlier versions, TeeChart has been this issue really long time
Transparent issues in colorgrid
-
Narcís
- Site Admin

- Posts: 14730
- Joined: Mon Jun 09, 2003 4:00 am
- Location: Banyoles, Catalonia
- Contact:
Hi HQO,
Null values in a database or Double.NaN values are not supported by TeeChart and must be customly handled as almost everybody marks them in a different way and also everybody wants to treat them in a different way. So you should loop through your datasource and when a null/nan value is identified, you should manually add it to the series using the AddNull methods provided or use Add method with Color.Transparent color argument.
Null values in a database or Double.NaN values are not supported by TeeChart and must be customly handled as almost everybody marks them in a different way and also everybody wants to treat them in a different way. So you should loop through your datasource and when a null/nan value is identified, you should manually add it to the series using the AddNull methods provided or use Add method with Color.Transparent color argument.
Best Regards,
| Narcís Calvet / Development & Support Steema Software Avinguda Montilivi 33, 17003 Girona, Catalonia Tel: 34 972 218 797 http://www.steema.com |
      |
| Instructions - How to post in this forum |
Thank's, I added NaN checking and now I'm able to show "transparent" points.... but still I have problems with those another points, which have a valid values... all valuepoints before null values are shown in solid color, after the null point, color of the each valuepoint is correct!?
I try to do a workaround by using the color parameter but still I have the same problems.
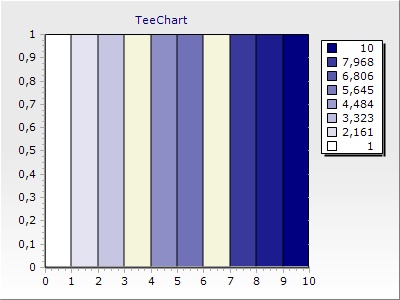
Here's a example with latest TeeChart. First points (1,2, 4, 5) are show in solid (red), there are two points (3 and 6), which are draw with Color - parameter. The last points (7,8,..) are shown in correct color (Color of the point is based on point value).
Can you reproduce this? Why other points than last points are shown in solid? (in red?)
private void button2_Click(object sender, EventArgs e)
{
tChart1.Axes.Left.Automatic = true;
tChart1.Axes.Bottom.Automatic = true;
for (int y = 0; y < 1; y++)
{
for (int x = 0; x < 10; x++)
{
if (x == 3 || x == 6)
colorGrid1.Add(x, x+1, y, Color.Beige);
else
colorGrid1.Add(x, x + 1, y);
}
}
}
-
Narcís
- Site Admin

- Posts: 14730
- Joined: Mon Jun 09, 2003 4:00 am
- Location: Banyoles, Catalonia
- Contact:
Hi HQO,
Thanks for the information.
We have done some tests here and there is a different behaviour in TeeChart for .NET v2 and v3. We think your code works fine in v3:

Is this the result you would expect?
Thanks in advance.
Thanks for the information.
We have done some tests here and there is a different behaviour in TeeChart for .NET v2 and v3. We think your code works fine in v3:

Is this the result you would expect?
Thanks in advance.
Best Regards,
| Narcís Calvet / Development & Support Steema Software Avinguda Montilivi 33, 17003 Girona, Catalonia Tel: 34 972 218 797 http://www.steema.com |
      |
| Instructions - How to post in this forum |

