Multiply Axes problem
Posted: Tue Apr 21, 2009 5:18 am
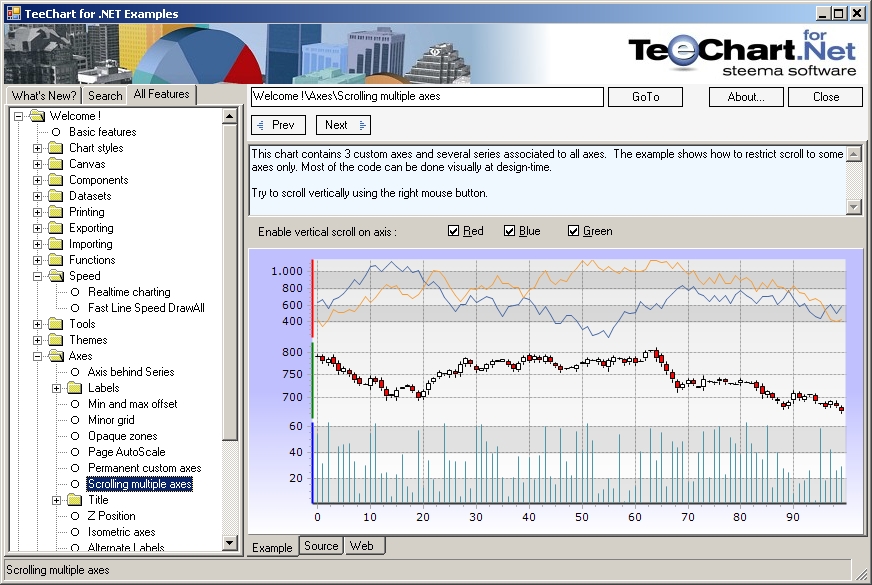
There are five dynamic lines (line1,line2, line3, line4, line5) in the panel, and I also assigned other four vertical axes (axis1, axis2, axis3, axis4) in the panel except the left and the bottom axes.
I want to show user like this:
The maximum and the minimum of left axis are connected with line1
The maximum and the minimum of axis1 are connected with line2
axis2 is associated with line3
axis3 is associated with line4
axis4 is associated with line5
In the area of curves, the maximum of left axis is the maximal Y value of line1, and the minimum is the minimal Y value of line1. Each line has a separate vertical axis and all the lines have the same horizontal axis. The lines would better are full of the area of curves.
Current status:
I have assigned all the lines and axes; meanwhile, I set property like this:
Opened the “Teechart Editer”->Series->chose a line->General ->Vertical Axis
Then, each line has only two axes, and lines are associated with the axes.
But, after debugging my project, I found that all the five axes have the same maximum and minimum. The maximum is the maximal Y value of all five lines, and the minimum is the minimal Y value of all five lines.
And, I have checked the Feature demo of your product, but I found no example for multiply axes. What should I do?
