TeeChart VCL for Borland/CodeGear/Embarcadero RAD Studio, Delphi and C++ Builder.
-
moelski
- Advanced
- Posts: 212
- Joined: Mon Apr 23, 2007 12:00 am
- Location: Germany
-
Contact:
Post
by moelski » Wed Jun 20, 2007 7:35 am
Hi !
Is it possible to add vendor information to the chart if it is exported to a graphic file or copied to the clipboard or send via email?
We want to add a date, a small text and a weblink (as text) to the chart.
The best way would be the following outfit:
Code: Select all
|--------------------------|
|                          |
|       CHART              |
|                          |
|--------------------------|
Date       Text      Weblink
But I have no idea if I can add something like this.
You can find an example here:
http://www.logview.info/vBulletin/attac ... 1149345249
-
Narcís
- Site Admin

- Posts: 14730
- Joined: Mon Jun 09, 2003 4:00 am
- Location: Banyoles, Catalonia
-
Contact:
Post
by Narcís » Wed Jun 20, 2007 7:54 am
Hi Dominik,
Yes, this is possible. The easiest option may be using annotation tools. You'll find examples at the features demo available at TeeChart's program group.
-
moelski
- Advanced
- Posts: 212
- Joined: Mon Apr 23, 2007 12:00 am
- Location: Germany
-
Contact:
Post
by moelski » Fri Nov 16, 2007 10:08 am
Hi Narcis,
well I try to implement your suggestion and it works. But I´m not really happy with it.
If I place the annotation at the bottom of the chart it will overwrite the time information. Do you have a simple methode, to resize the chart for about 8-10 pixels so that the annotation will with to the bottum without overwriting the time info?
So allways I do an export the following procedure should be done:
1) resize the chart height for about 10 pixels (to get some free space at the bottom)
2) create, place and cinfigure the annotation
3) execute the export, copy, what ever ...
4) delete the annotation
5) draw chart in the old height
Do you have an example for this ?
-
Narcís
- Site Admin

- Posts: 14730
- Joined: Mon Jun 09, 2003 4:00 am
- Location: Banyoles, Catalonia
-
Contact:
Post
by Narcís » Fri Nov 16, 2007 10:19 am
Hi Dominik,
I'm not sure about which is your exact problem. However, modifying chart margins may help you, for example:
-
moelski
- Advanced
- Posts: 212
- Joined: Mon Apr 23, 2007 12:00 am
- Location: Germany
-
Contact:
Post
by moelski » Fri Nov 16, 2007 11:43 am
Hi Narcis,
ok this works for me:
Code: Select all
procedure TForm1.Grafik_KopierenClick(Sender: TObject);
var lastTool      : Integer;
    Annotation    : TAnnotationTool;
begin
  // Annotation erzeugen
  Annotation := TAnnotationTool.Create(self);
  MainChart.Tools.Add(Annotation);
  lastTool := MainChart.Tools.Count - 1;

  if (MainChart.Tools[lastTool] is TAnnotationTool) then begin
    TAnnotationTool(MainChart.Tools[lastTool]).Text := 'www.LogView.info';

    TAnnotationTool(MainChart.Tools[lastTool]).Shape.CustomPosition := True;
    TAnnotationTool(MainChart.Tools[lastTool]).Shape.AutoSize       := False;
    TAnnotationTool(MainChart.Tools[lastTool]).Shape.Left           := -1;
    TAnnotationTool(MainChart.Tools[lastTool]).Shape.top            := MainChart.Height - 16;

    TAnnotationTool(MainChart.Tools[lastTool]).Shape.Width          := MainChart.Width + 4;
    TAnnotationTool(MainChart.Tools[lastTool]).Shape.Height         := 18;

    TAnnotationTool(MainChart.Tools[lastTool]).Shape.Shadow.Visible := False;
  end;

  MainChart.MarginBottom := 14;
  MainChart.CopyToClipboardBitmap;
  MainChart.MarginBottom := 4;

  MainChart.Tools[lastTool].Free;
end;
But how can I set the Margins of an annotation by code ?
-
Narcís
- Site Admin

- Posts: 14730
- Joined: Mon Jun 09, 2003 4:00 am
- Location: Banyoles, Catalonia
-
Contact:
Post
by Narcís » Fri Nov 16, 2007 12:17 pm
Hi Dominik,
Sorry but I don't understand what you are trying to achieve. Could you please send us an image of what you are trying to do? You can post your files at news://
www.steema.net/steema.public.attachments newsgroup or at our
upload page.
Thanks in advance!
-
moelski
- Advanced
- Posts: 212
- Joined: Mon Apr 23, 2007 12:00 am
- Location: Germany
-
Contact:
Post
by moelski » Fri Nov 16, 2007 12:28 pm
Hi Narcis,
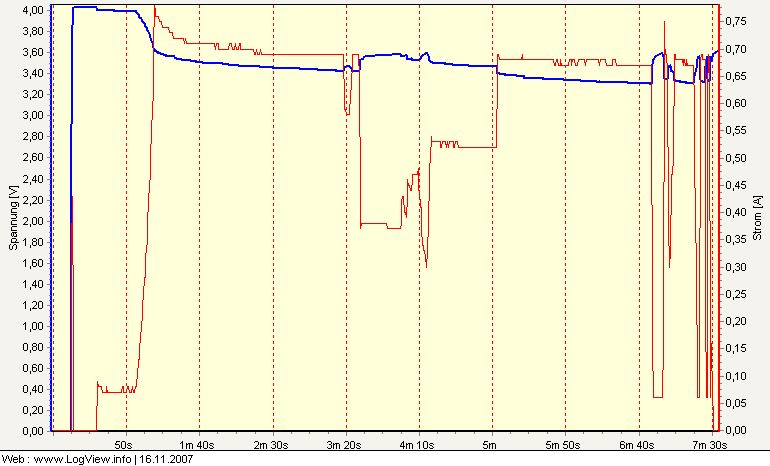
ok here is a picture:

I want to add some special information (an annotation) at the bottom -> "Web : www............ I have done this now and it works for me.
My only problem is that I have no idea how to set the margins of the annotation.
I want to set the margins from the annotation to:
- Units : Pixels
- and custom Top, Left, ....
-
Pep
- Site Admin

- Posts: 3318
- Joined: Fri Nov 14, 2003 5:00 am
-
Contact:
Post
by Pep » Mon Nov 19, 2007 12:55 pm
Hi Dominik,
you can set them by using :
Code: Select all
procedure TForm1.BitBtn2Click(Sender: TObject);
begin
  with ChartTool1 do
  begin
    Shape.CustomPosition := true;
    PositionUnits := muPixels;
    Left := Chart1.ChartBounds.Left + 2 ;
    Top := Chart1.height-charttool1.height - 2;
  end;
end;
-
moelski
- Advanced
- Posts: 212
- Joined: Mon Apr 23, 2007 12:00 am
- Location: Germany
-
Contact:
Post
by moelski » Mon Nov 19, 2007 12:57 pm
Hi Pep,
but I think that code wouldn´t set the margins. Right ?
-
Pep
- Site Admin

- Posts: 3318
- Joined: Fri Nov 14, 2003 5:00 am
-
Contact:
Post
by Pep » Mon Nov 26, 2007 12:22 pm
Hi Dominik,
using the following code should work fine :
Code: Select all
procedure TForm1.BitBtn1Click(Sender: TObject);
var lastTool      : Integer;
    Annotation    : TAnnotationTool;
begin
  // Annotation erzeugen
  Annotation := TAnnotationTool.Create(self);
  MainChart.Tools.Add(Annotation);
  lastTool := MainChart.Tools.Count - 1;

  if (MainChart.Tools[lastTool] is TAnnotationTool) then begin
    TAnnotationTool(MainChart.Tools[lastTool]).Text := 'www.LogView.info';

  with TAnnotationTool(MainChart.Tools[lastTool]) do
  begin
    Shape.CustomPosition := true;
    Shape.Shadow.Visible := False;
    PositionUnits := muPixels;
    Left := Mainchart.ChartBounds.Left + 2 ;
    Top := Mainchart.height-height - 20;
  end;
  end;

  MainChart.MarginBottom := MainChart.MarginBottom+3;
  MainChart.CopyToClipboardBitmap;
  MainChart.MarginBottom := MainChart.MarginBottom-3;

  MainChart.Tools[lastTool].Free;
end;


