
I'm displaying data on a 3D chart like so:
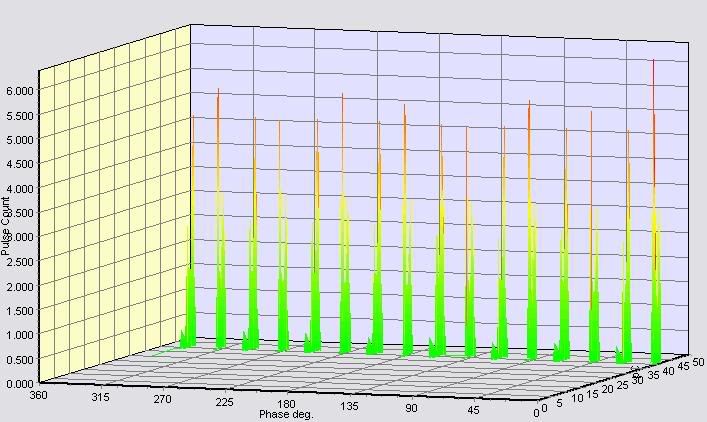
The bottom axis, Phase deg, displays data from 360 -> 0.
Is there any way to format this axis so that it displays the labels, and data, in reverse order? I.e. from 0 -> 360 instead? I tried swapping the values of minimum and maximum, but it does not appear to be possible to have a max value lower than the min value.


