As a background to the new release of TeeChart for BlackBerry, you may be interested in reading the tutorial we have written on the subject of Charting for BlackBerry.
This tutorial shows how easy it is to create a simple BlackBerry application through the Eclipse IDE.
To download and use TeeChart for BlackBerry follow the link to TeeChart for Java evaluation downloads.
For more information take a look at the TeeChart's Mobile pages.
Charting for BlackBerry
Pep Jorge | Steema Software | January 2013
Abstract
TeeChart for Java now has an extension, TeeChart for BlackBerry© which allows you to generate BlackBerry Charts. It’s a developer library that provides a professional charting engine for all kind of applications. It's designed specifically for the BlackBerry OS.
Keywords: BlackBerry, Java, TeeChart
Introduction
Usage and integration of the TeeChart charting library is an easy task for any developer wishing to include charts in their BlackBerry apps.
The API comes with 100% Managed Code. TeeChart for BlackBerry is written on 100% pure Java, making use of the BlackBerry JDE. Your application can use managed code and be sure that memory and resources required for library will be properly managed and cleared by the BlackBerry OS.
Charting for BlackBerry with TeeChart
This tutorial tries to show how easy it is to create a simple BlackBerry application through the Eclipse IDE. We’re going to create a DashBoard application.
First of all one has to be sure all the required software is installed on the computer. Take a look here or the BlackBerry development requirements.
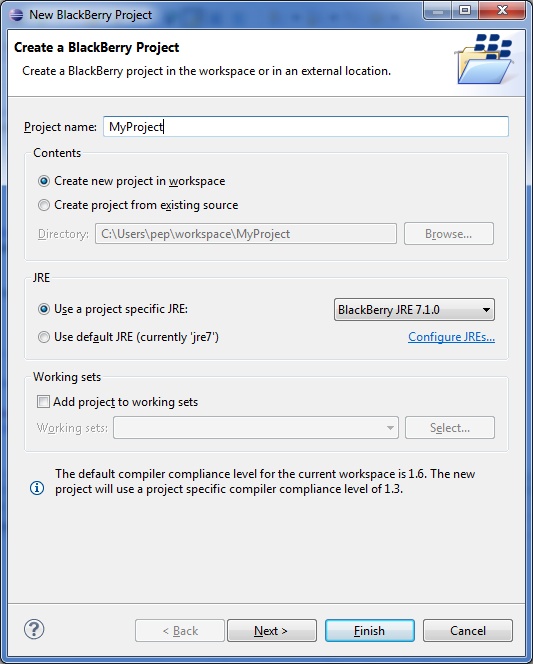
Once all is ready, lets get going and create the new Blackberry app.

Write its application name and click “Finish”.
The first thing we're going to do is reference the TeeChart for BlackBerry library in our project. For that we do a right-mousebutton over the project name in the Package Explorer and select Properties->Java Build Path. We go to the "Libraries" tab and click “Add external JAR”. We'll look for where we have the “TeeChartBlackBerry.jar” file and add it with "Ok".
Once we have the TeeChart reference in place we can add our code to the window where we'll create the Chart (or Charts).
If we open the MyScreen.java class we can see:
package mypackage;

import net.rim.device.api.ui.container.MainScreen;

/**
 * A class extending the MainScreen class, which provides default standard
 * behavior for BlackBerry GUI applications.
 */
public final class MyScreen extends MainScreen
{
    /**
     * Creates a new MyScreen object
     */
    public MyScreen()
    {
        // Set the displayed title of the screen
        setTitle("MyTitle");
    }
}
To begin using the TeeChart charting library we'll add an import:
import com.steema.teechart.*;
This will permit us to have access to all the classes in the TeeChart library. In this example we're going to create three charts that we'll position on different parts of the screen, adjusting their size accordingly to obtain the dashboard.
Defining and creating charts
To define three different charts we can simply define three chart names in the MyScreen class:
TChart tChart1;
TChart tChart2;
TChart tChart3;
We need to add the constructors for the charts in the MyScreen class constructor MyScreen(). We can setup parameters of the charts as we create them:
        // Creates the Chart object
        tChart1 = new TChart();

        // Setting its bounds
        tChart1.setHeight(220);
        tChart1.setWidth(240);

        // Applying a specific theme to the Chart - Opera theme
	  ThemesList.applyTheme(tChart1.getChart(), 1);

		// Setting Header characteristics
        tChart1.getHeader().setVisible(false);

        // Changing aspect to 2D
	  tChart1.getAspect().setView3D(false);

	  // Setting Legend characteristics
	  tChart1.getLegend().setVisible(false);

	  // Setting Walls characteristics
	  tChart1.getWalls().getBack().getPen().setVisible(false);

	  // Setting Panel characteristics
	  tChart1.getPanel().getBorderPen().setVisible(false);
        tChart1.getPanel().setMarginBottom(0);
        tChart1.getPanel().setMarginTop(0);
        tChart1.getPanel().setMarginLeft(0);
        tChart1.getPanel().setMarginRight(0);

        // Setting Bevel Width
        tChart1.getPanel().setBevelWidth(0);
Now we'll comment the code above. As we commented before, we'll create the object tChart1 and give it specific dimensions. TeeChart for Blackberry allows us to apply a theme (choosing from amongst several defined in the TeeChart library). Here we'll choose the Theme called Opera. Amongst other characteristics we'll set the Chart header to visible-false, change the aspect visualisation to 2D, hide the Legend, disable the borders for Back Wall and Panel, change the Panel margins and specify the Bevel width.
Now we'll add series and data to tha chart, using this code:
Pie pie1 = new Pie(tChart1.getChart());
pie1.setCircled(true);
pie1.getMarks().setVisible(false);
pie1.fillSampleValues(4);
Here we've created a Pie Series adding it to the chart tChart1 and we've modified some characteristics of the Series, for example setting the Pie to true circle with the Circled property and setting the Marks to invisible.
Next we'll add sample data to the series using fillSampleValues(). Remember that this method is intended to add simulated data to the Series, for a real case application it'll interest us more to add real data manually froma valid datasource, sourcing for example from a database, an array or data list, etc.... In these cases we would use overloads of the Add() method. For example:
pie1.add(value);
Now it's time to do the same for the other dashboard charts, using the following code to create the charts and add series to them as we did for the first chart, modifying characteristics as before:
      // Chart 2
        tChart2 = new TChart();

        tChart2.setHeight(220);
        tChart2.setWidth(400);

        tChart2.getPanel().setMarginBottom(0);
        tChart2.getPanel().setMarginTop(0);
        tChart2.getPanel().setMarginLeft(0);
        tChart2.getPanel().setMarginRight(10);

        tChart2.getFooter().setVisible(false);

	  tChart2.getAspect().setView3D(false);
	  tChart2.getLegend().setVisible(false);
        tChart2.getHeader().setVisible(false);

	  ThemesList.applyTheme(tChart2.getChart(), 1);

        tChart2.getWalls().getBack().setTransparent(true);
	  tChart2.getWalls().getBack().getPen().setVisible(false);

	  tChart2.getPanel().getBorderPen().setVisible(false);
        tChart2.getPanel().setBevelWidth(0);

	  Bar bar = new Bar(tChart2.getChart());
	  bar.getMarks().setVisible(false);
	  bar.fillSampleValues(10);

	  // Chart 3
        tChart3 = new TChart();
        tChart3.setHeight(230);
        tChart3.setWidth(640);
        ThemesList.applyTheme(tChart3.getChart(), 1);

        tChart3.getPanel().setMarginBottom(0);
        tChart3.getPanel().setMarginTop(0);
        tChart3.getPanel().setMarginLeft(0);
        tChart3.getPanel().setMarginRight(10);

        tChart3.getFooter().setVisible(false);

        tChart3.getAspect().setView3D(false);

        tChart3.getLegend().setVisible(false);

        tChart3.getHeader().setVisible(false);

        tChart3.getWalls().getBack().setTransparent(true);
        tChart3.getWalls().getBack().getPen().setVisible(false);

	  tChart3.getPanel().getGradient().setVisible(true);
	  tChart3.getChart().getPanel().getBorderPen().setVisible(false);
        tChart3.getPanel().setBevelWidth(0);

		/* FastLine Series */
		FastLine fast1 = new FastLine(tChart3.getChart());
		fast1.fillSampleValues(100);
		fast1.setTreatNulls(TreatNullsStyle.DONOTPAINT);
		fast1.setDrawAllPointsStyle(DrawAllPointsStyle.MINMAX);
		fast1.setDrawAllPoints(false);

		FastLine fast2 = new FastLine(tChart3.getChart());
		fast2.fillSampleValues(100);
		fast2.setTreatNulls(TreatNullsStyle.DONOTPAINT);
		fast2.setDrawAllPointsStyle(DrawAllPointsStyle.MINMAX);
		fast2.setDrawAllPoints(false);

		FastLine fast3 = new FastLine(tChart3.getChart());
		fast3.fillSampleValues(100);
		fast3.setTreatNulls(TreatNullsStyle.DONOTPAINT);
		fast3.setDrawAllPointsStyle(DrawAllPointsStyle.MINMAX);
		fast3.setDrawAllPoints(false);
All that's left is to add the charts to the screen window in the same way as we would add any other Field or displayable object. Let's use the VerticalFieldManager and HorizontalFieldManager to position each chart in a specific place and to modify a few characteristics to improve the appearance:
        VerticalFieldManager verticalFieldManager = new
		VerticalFieldManager(Field.FIELD_HCENTER);
        HorizontalFieldManager horizontalFieldManager2 = new
		HorizontalFieldManager(Field.FIELD_HCENTER);

        horizontalFieldManager2.add(tChart1);
        horizontalFieldManager2.add(tChart2);
        verticalFieldManager.setBackground
(BackgroundFactory.createSolidTransparentBackground(0x111111,180));
        horizontalFieldManager2.setBackground
(BackgroundFactory.createSolidTransparentBackground(0x111111,180));

        verticalFieldManager.add(horizontalFieldManager2);
        verticalFieldManager.add(new SeparatorField());

        verticalFieldManager.add(tChart3);
        horizontalFieldManager2.getExtent().width=0;

        add(verticalFieldManager);
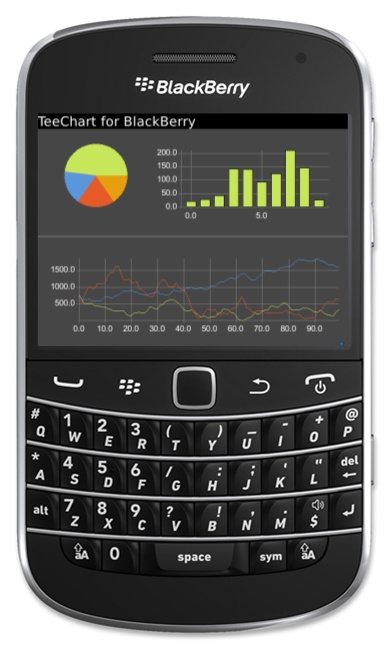
Once we have all the code in our MyScreen class we just need to run it to see the result. One run option would be to use the BlackBerry simulator by right-clicking over the project and selecting Project ->Run as->BlackBerry Simulator.
Notice that in the case you are using the TeeChart for BlackBerry (non source code version), .cod files should be loaded to the simulator in order to be able to run the example.
You can find the .cod files inside the TeeChart.BlackBerry.jar file, just extract the .jar file, select all the *.cod files and load them by clicking File -> “Load BlackBerry Application or Theme..” through simulator window.
This will show the following result:

PDF Version here
To search for more information related to this subject see the Steema Forums.
| Copyright 2013 Steema Software SL. Copyright Information. e-mail info@steema.com.
Privacy Policy All other brands and product names are trademarks or registered trademarks of their respective owners. |
||||
