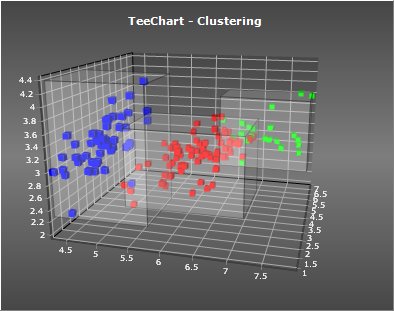
This TeeChart VCL preview demo includes classes and components to perform "clustering" on your data. Clustering is the process of grouping data according to how well related the individual items are. See http://en.wikipedia.org/wiki/Cluster_analysis for more information.
The linked demo, http://www.steema.us/files/public/teechart/vcl/demos/clustering/TeeChart_Clustering.zip, is a working example that uses a TeeChart to chart clustered data.
See the background information in this document for more information.
Common parameters:
Distance
Cluster calculation is based on the "distance" between a data item and the other data items.
There are several ways to calculate the "distance" between items. The algorithms are agnostic, they call the Provider (ie: Series provider) to obtain the distances. For example, on a XY scatter plot, the distance between points can be the hypotenuse (Pythagoras' theorem), that is, the simple Euclidean distance between a point XY and another XY.
Distance calculations implemented:
('dm' prefixed types) Euclidean, SquaredEuclidean, Manhattan, Minkowski, Sorensen, Chebyshev
Example:
ClusteringTool1.Distance := dmMinkowski;
ClusteringTool1.MinkowskiLambda := 4;
Linkage
There are several ways to calculate the "distance" between clusters when one or the two clusters have more than one item. This is called "linkage". The most simple way is by using each cluster "center" (this means no linkage occurs).
Other linkage styles implemented:
- Single
lmSingle - Also called "minimum". The distance between cluster A and B is the minimum distance between all items in cluster A and all items in cluster B.
lmComplete - Also called "maximum". The distance between cluster A and B is the maximum distance between all items in cluster A and all items in cluster B.
lmAverage - The distance between cluster A and B is the average distance between all items in cluster A and all items in cluster B.
lmWard - The result is the increase on "error sum of squares" when adding cluster B items to cluster A.
